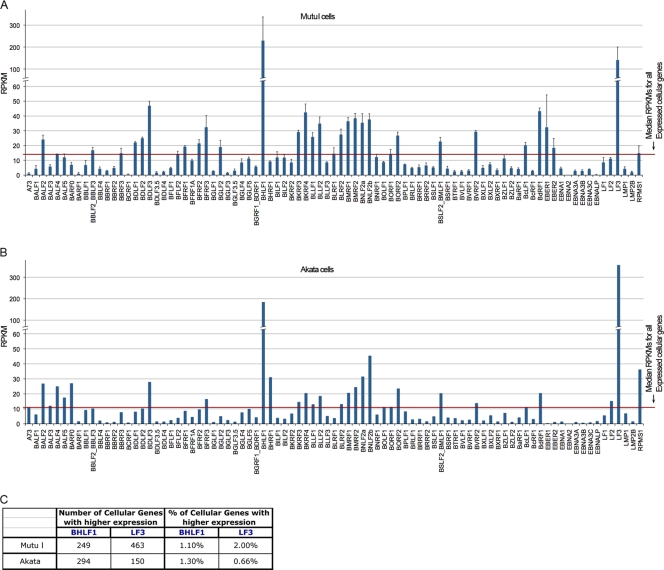
FIG. 2.
RPKM values for EBV genes in Mutu I (A) and Akata (B) cells. Mutu I cell results are the averages from two technical replicates (TR) from each of two separate RNA preparations. Error bars indicate the standard deviation for each gene. (C) The number and percentage of genes showing higher RPKM values than those for BHLF1 and LF3 in Mutu I and Akata cells out of a total of 22,803 annotated cellular and viral genes.

