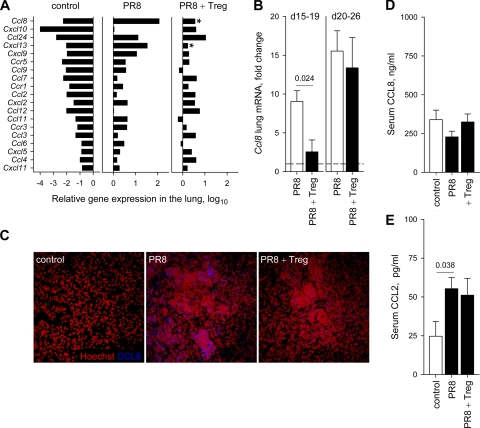
FIG. 6.
Treg cells alter the pattern of chemokine expression in IAV-infected lymphocyte-deficient mice. (A) Relative expression of chemokine and chemokine receptor genes, measured by microarray analysis in uninfected Rag1−/− control mice (control) and 15 days following PR8 infection of Rag1−/− mice, in the presence (PR8 + Treg) or absence (PR8) of adoptively transferred Treg cells. Only genes whose expression changed significantly (P ≤ 0.05) by more than 2-fold in PR8-infected groups compared to that of the uninfected control group are included. Asterisks in the PR8 + Treg plot denote the chemokine genes whose expression changed significantly (P ≤ 0.05) between the PR8 and the PR8 + Treg groups. (B) Fold change in Ccl8 transcription in the lungs of PR8-infected Rag1−/− mice with (PR8 + Treg) or without (PR8) transferred Treg cells before (days 15 to 19) and during (days 20 to 26) the appearance of severe clinical disease in PR8-infected Rag1−/− recipients of Treg cells. Plots show the mean (± standard errors of the mean [SEM]) values of three to eight mice per group per time point. (C) Immunofluorescent detection of CCL8 (blue) in the lungs of uninfected Rag1−/− control mice (control) and 14 days following PR8 infection of Rag1−/− mice in the presence (PR8 + Treg) or absence (PR8) of adoptively transferred Treg cells. Lung sections were counterstained with Hoechst (red) to reveal cell nuclei and are representative of two to four mice per group. (D) Levels of CCL8/MCP-2 measured in the sera of uninfected Rag1−/− control mice (control) or PR8-infected Rag1−/− mice with (PR8 + Treg) or without (PR8) transferred Treg cells. Plots show the mean (±SEM) values of 5 to 14 mice per group. (E) Levels of CCL2/MCP-1 measured in the sera of uninfected Rag1−/− control mice (control) or PR8-infected Rag1−/− mice with (PR8 + Treg) or without (PR8) transferred Treg cells. Plots show the mean (±SEM) values of 5 to 12 mice per group.

