FIG. 4.
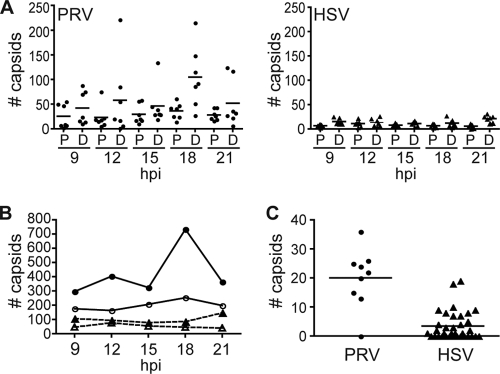
Frequency of capsid trafficking in axons during egress. (A) Dissociated chick DRG sensory neurons were infected with PRV RFP-cap/GFP-env (circles) or HSV-1 RFP-cap/GFP-env (triangles), and seven neurons were imaged during the indicated times postinfection. For each neuron, a proximal (P) and distal (D) region of the axon were imaged in a 58.5-μm by 78-μm field, and the number of individual capsids present in the axon segment was determined. Bars indicate mean values. (B) Summary of the data presented in panel A. The total number of capsids present in axons at the each time postinfection for PRV RFP-cap/GFP-env (circles; solid lines) or HSV-1 RFP-cap/GFP-env (triangles; dashed lines) at proximal (open symbols) or distal (closed symbols) sites are indicated. (C) Comparison of total anterograde transport events captured as part of the current HSV-1 RFP-cap/GFP-env study or from a previous study of PRV RFP-cap/GFP-env (5). Imaging for both studies was during peak egress (PRV, 10 to 13 h postinfection; HSV-1, 18 to 24 h postinfection) in dissociated chick DRG sensory neurons. The number of moving capsids (PRV = 181 capsids; HSV-1 = 123 capsids) recorded during each independent experiment (for PRV, 9 experiments; for HSV-1, 35 experiments) is indicated. Bars indicate mean values.

