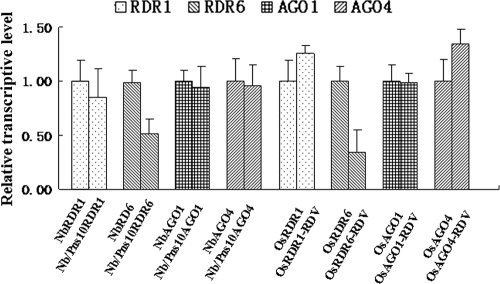
FIG. 7.
Quantitative real-time RT-PCR analysis of RDR1, RDR6, AGO1, and AGO4 transcript levels in N. benthamiana (Nb), Nb/Pns10, RDV-infected rice and mock-inoculated healthy rice. Each mean value is derived from three pools of plants, with each pool comprising three plants. Error bars represent SEs of the mean. Relative transcript levels were calculated by using the DDC(t) method (22) with N. benthamiana GAPDH or Oryza sativa actin transcripts serving as an internal standard.

