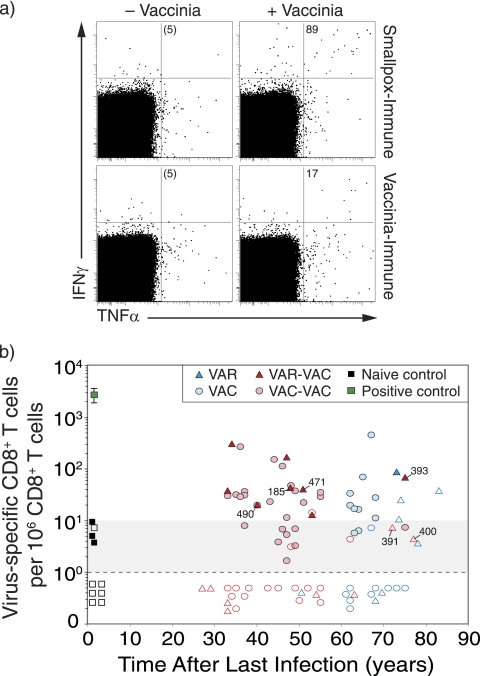
FIG. 2.
Virus-specific CD8+ T-cell memory after smallpox infection or vaccination. (a) Representative flow cytometry dot plots from a smallpox-immune subject (73 years after infection) and a VAC-immune subject (64 years after vaccination). The dot plots are gated on CD4− CD8+ T cells and show the number of IFN-γ+ TNF-α+ cells per 106 CD8+ T cells after background subtraction (− Vaccinia). (b) Orthopoxvirus-specific CD8+ T cells were measured as a function of time after infection or vaccination. The samples were analyzed in parallel to the antiviral CD4+ T-cell responses examined in Fig. 1, and the same symbols and group definitions are as described in the legend to Fig. 1.

