FIG. 1.
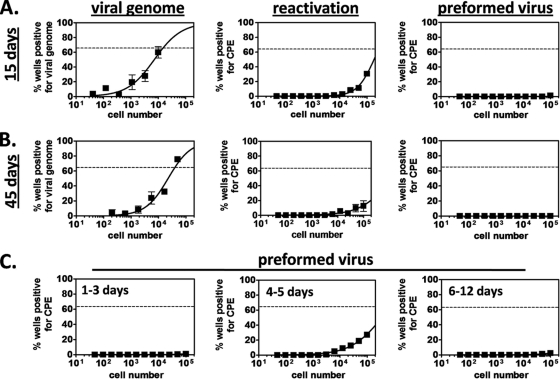
Latency and acute replication analyses of the bone marrow. To examine MHV68 infection of the bone marrow, C57BL6/J (B6) mice were infected i.p. or i.n. with 104 PFU of MHV68. At various times postinoculation, femurs and tibias were harvested and flushed with 10 ml Dulbecco modified Eagle medium containing 10% fetal calf serum. (A and B) Latency analyses. For each sample group in each experiment (n = 3 experiments), bone marrow cells from 5 mice were pooled, and parallel samples of single-cell suspensions were analyzed to determine the frequencies of bone marrow cells that harbor viral genome, reactivate from latency, and carry preformed infectious virus, as previously described (36, 41). For limiting dilution nested PCR analyses, cells were serially diluted in a background of uninfected RAW264.7 murine macrophages and dilutions were loaded into a 96-well plate at 12 wells per dilution. Following lysis with proteinase K, single-copy-sensitive nested PCR was performed using primers specific for MHV68 ORF72. Samples containing 10, 1, 0.1, or no copies of ORF72 DNA were included as controls. Reaction mixtures were scored for the presence of amplicon by ethidium bromide visualization on a 3% agarose gel. The frequency of cells positive for viral genome was calculated by Poisson distribution analysis of mean data from 3 experiments. On graphs, the dashed line at 63.2% indicates the point at which one viral genome-positive cell per reaction is predicted to occur. The x axis shows the numbers of cells per reaction; the y axis shows the percentages of 12 reactions positive for viral genome. For limiting dilution ex vivo reactivation assays, serial dilutions of live cells were plated on fibroblast monolayers. After incubation for 3 weeks, monolayers were scored for cytopathic effect (CPE). The frequency of cells that spontaneously reactivated from latency was calculated by Poisson distribution analysis of mean data from 3 experiments. On graphs, the dashed line at 63.2% indicates the point at which one reactivation event per well is predicted to occur. The x axis shows the numbers of cells per reaction; the y axis shows the percentages of 12 reactions positive for CPE. For preformed infectious virus assays, cells were subjected to mechanical disruption, which destroys cells and therefore eliminates reactivation from latency but does not harm viral particles. Disrupted samples were serially diluted on fibroblast monolayers and scored for CPE exactly as described for reactivation assays. (C) Acute replication analyses. To analyze acute replication, bone marrow samples were harvested and processed exactly as described for latency preformed infectious virus assays.

