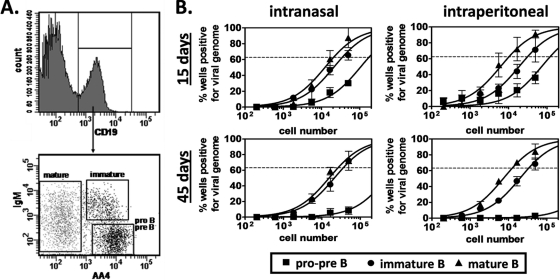
FIG. 2.
Latency analyses of developing B cell subsets in the bone marrow. For these experiments, B6 mice were infected i.p. or i.n. with 104 PFU of MHV68. At 15 or 42 to 48 days postinoculation, femurs and tibias were harvested and flushed with 10 ml Dulbecco modified Eagle medium containing 10% fetal calf serum. For each sample group in each experiment (n = 3 experiments), bone marrow cells from 8 to 10 mice were pooled. Following blocking, cells were stained with rat anti-mouse antibody: CD19-allophycocyanin/Cy7 (clone 1D3; BD Biosciences), AA4-allophycocyanin (clone AA4.1; eBioscience), and IgM-phycoerythrin-Cy7 (clone R6-60.2; BD Biosciences). (A) Flow cytometric cell sorting was performed to isolate purified pro-pre-B cells (CD19+ AA4+ IgM−), immature B cells (CD19+ AA4+ IgM+), and mature B cells (CD19+ AA4−). Mean purities for each population were as follows: pro-pre-B cells, 97.4% ± 0.7%; immature B cells, 96.7% ± 0.8%; mature B cells, 95.0% ± 1.3%. (B) To determine the frequencies of cells that harbored latent virus, sorted populations were subjected to limiting dilution nested PCR for viral genome, exactly as described for Fig. 1. The frequency of cells positive for viral genome was calculated by Poisson distribution analysis of mean data from 3 experiments. On graphs, the dashed line at 63.2% indicates the point at which one viral genome-positive cell per reaction is predicted to occur. The x axis shows the numbers of cells per reaction; the y axis shows the percentages of 12 reactions positive for viral genome.

