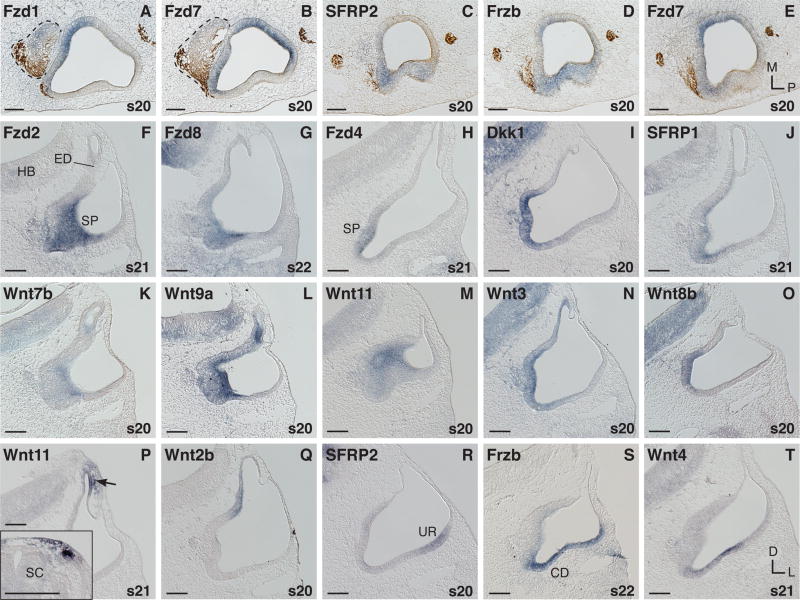
Fig. 2. mRNA expression in the otocyst (s20–22).
A-E: Horizontal sections through the broad middle otocyst; anterior is to the left, statoacoustic ganglion (SAG) dashed line. A,B: Comparison of Fzd1 and Fzd7 on adjacent sections. C,D: Expression of two Wnt inhibitors, SFRP2 and Frzb, compared with E: Fzd7 on adjacent sections of the same ear. F-T: Transverse sections. F-O: Transcripts in the anterior and medial otocyst. F-H: Fzds. I,J: Wnt antagonists. K-O: Wnts. F,G and K-M: Anterior-middle section level through the otocyst. H-J and N,O: Middle-posterior otocyst section level. P: Neural crest derived mesenchyme cells expressing Wnt11 adjacent to the endolymphatic sac primordium (arrow). P inset: Wnt11 expression in neural crest cells and the dorsal somite at trunk levels (same embryo as in P). Q: Dorsal-medial expression of Wnt2b. R-T: Lateral otocyst expressors. Abbreviations: CD, cochlear duct; D, dorsal; ED, endolymphatic duct/sac; HB, hindbrain; L, lateral; M, medial; P, posterior; s, embryonic stage; SC, spinal cord; SP, sensory primordium; UR, utricular recess. In situ hybridization signals (purple) are counterstained by axon labeling with 3A10 antibody (brown) in A-E. Scale bar =100μm.

