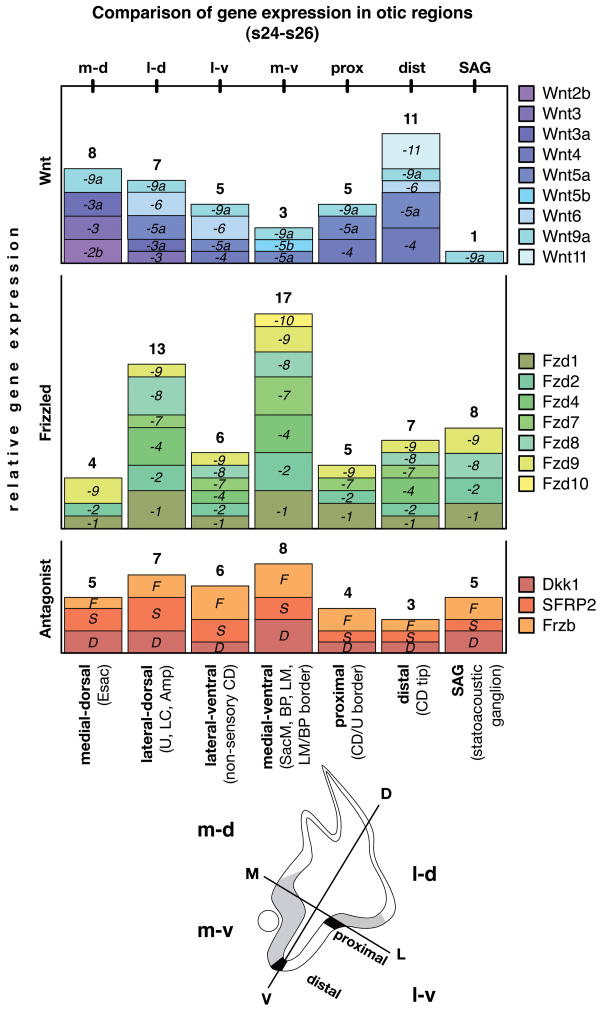
Fig. 4. Relative comparison of gene expression in otic regions (s24-s26).
Qualitatively scored expression of Wnts (blue), Frizzleds (green), and Wnt antagonists (red) allow a comparison of different otic regions and the diversity of genes contributing to each expression domain. The box height refers to a qualitative score from 1–3 that indicates either a) relative expression strength/distinctiveness (signal vs. background and compared to positive control tissue of the same embryo); b) expression duration; or c) local restriction within the domain. That means, a gene with the score 1 (small box) is either expressed weakly in that domain compared to its expression elsewhere in the embryo, or a score 1 refers to a limited duration within the time window discussed, or finally a score 1 indicates a localized expression e.g. only in parts of the lateral dorsal otic anlage. The number above each diagram block is the sum of expression units (scores), representing relative gene expression per otic region. Schematic provides orientation of otocyst quadrants (m-d, m-v, l-d, l-v), illustrates locations of prosensory domains (gray), and indicates proximal and distal border domains (black). Abbreviations: Amp, semicircular canal ampulla; BP, basilar papilla; CD, cochlear duct; CD/U border, border between CD and U; D, dorsal; Esac, endolymphatic sac; L, lateral; LC, lateral crista; LM, lagena macula; LM/BP border, inter-sensory border between LM and BP (not indicated in schema); M, medial, s, embryonic stage; SacM, saccular macula, U, utricle, V, ventral.

