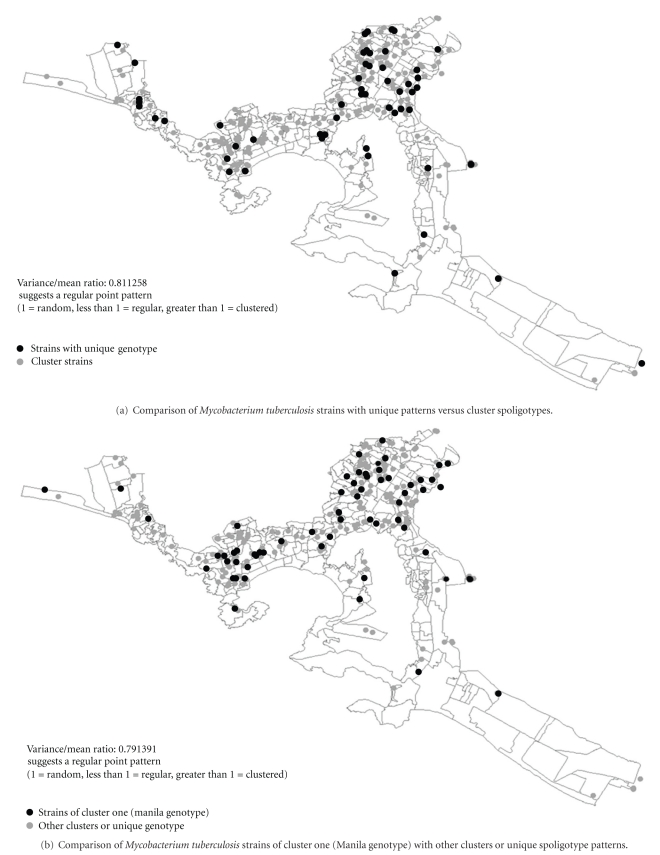
Figure 2.
Geographical distribution of tuberculosis cases in Acapulco, Mexico. Mapping and georeferencing of tuberculosis cases used a scale of 1 : 50000. Point cluster analysis relied on the IDRISI QUADRAT module. The variance/mean ratio significantly smaller than 1.0 suggests a regular distribution, while values greater than 1.0 suggest spatial clustering.

