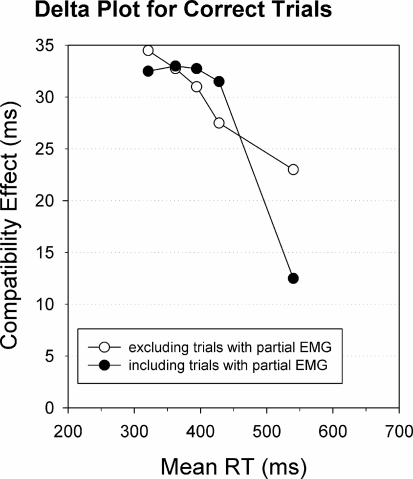
Figure 7.
RT delta plots including and excluding partial error trials. RT delta plots for trials with a correct button-press response. Including trials with partial EMG errors yields a steeper negative slope value (black circles) compared to excluding EMG error trials (white circles). Re-analyzed data published by Burle et al. (2002).

