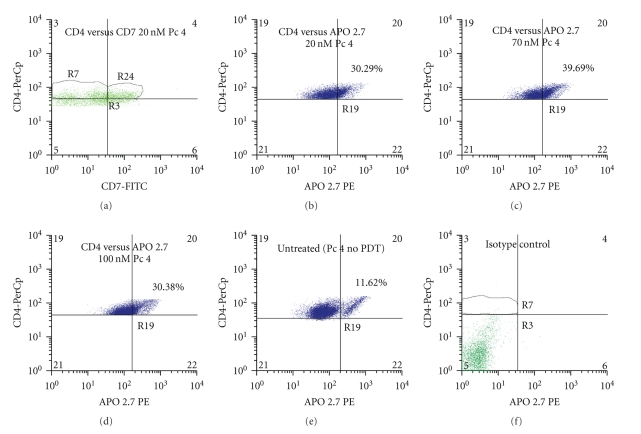
Figure 3.
Representative flow cytometric histograms of the induced apoptosis of CD4+CD7+ lymphocytes treated with Pc 4-PDT. Total blood was obtained from patients diagnosed with Sezary syndrome. The histograms shown were taken from a single patient with SS. PBMCs were isolated, treated with Pc 4, and stained as mentioned previously in the Methods section. Lymphocytes were identified by their high CD4 expression (y-axis) and forward scatter (x-axis) as described previously. CD4+CD7+ lymphocytes were further identified in region R24 in (a). Levels of apoptosis induced by all three doses in this population were then analyzed. As shown in (b), (c), and (d), these levels remained relatively similar and P-values were largely insignificant from group to group. Apoptosis induction in the untreated group is shown in (e).

