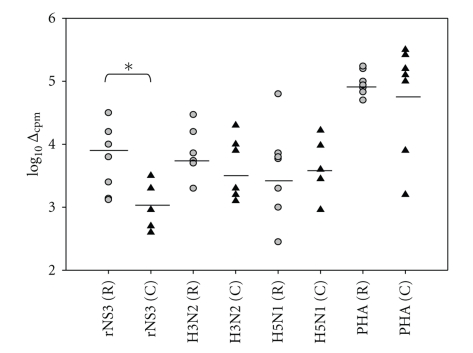
Figure 1.
Resolved HCV subjects have a significantly higher T cell response to rNS3 than chronic HCV subjects. PBMCs from both resolved subjects (gray circle) (n = 8) and chronic (black triangle) (n = 8) subjects (subjects used in Figure 1 are ∗ in Table 1) were individually incubated with rNS3 (1 μg/ml) and H3 (3 μg/ml), H5 (3 μg/ml), and PHA (2 μg/ml) for 7 days. All subjects were screened in the same proliferation assay. As described in the results, the algorithm: log10 Δmax was used to transform the data [29]. The P < .05* as determined by Student's t-test.

