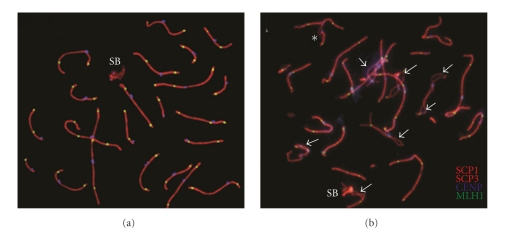
Figure 3.
Immunolabeled pachytene cells with synaptonemal complexes. (a) Representative image from the control group showing the normal morphology of the synaptonemal complex and sex body (SB). (b) Representative image of the cytological analysis of the patient's cells. Arrowheads indicate multiple asynaptic regions in the autosomal synaptonemal complex; an asterisk indicates a loop of asynapsis as a consequence of pericentromeric heterochromatin polymorphism of chromosome 9. SCP1 and SCP3 indicate synaptonemal complexes in red; CENP indicates centromere in blue, and MLH1 (mut L homolog 1) indicates recombination foci in green.

