Figure 7.
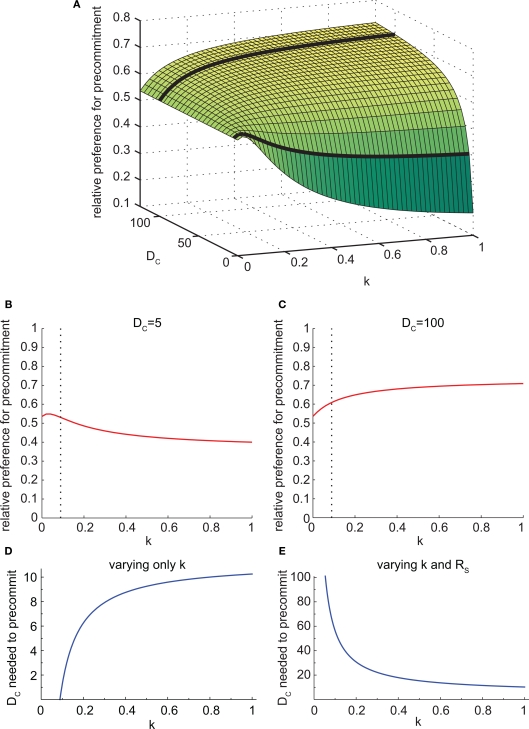
The discounting rate has a complex interaction with precommitment behavior. (A) Precommitment preference plotted against k and DC. The heavy black lines show the intersection of the planes DC = 5 and DC = 100 with this surface, representing the lines in (B) and (C). (B) When DC was small (DC = 5), faster discounting yielded less precommitment. The dashed line represents the value of k above which SS was preferred over LL. (C) When DC was large (DC = 100), faster discounting yielded greater precommitment. The dashed line represents the value of k above which SS was preferred over LL. (D) As k increased, the amount of DC required to prefer precommitment also increased. Faster discounting increased the amount of DC required to produce precommitment. When k was less than 4/45, LL was preferred over SS, so N was preferred over C even when there was no precommitment delay. (E) The SS–LL preference ratio was held constant by adjusting RS. Under this condition, the amount of DC required to precommit grew as k increased. In other words, for a given SS–LL preference, agents with slower discounting will require a much longer DC to achieve precommitment. This figure was generated with mathematical hyperbolic discounting.

