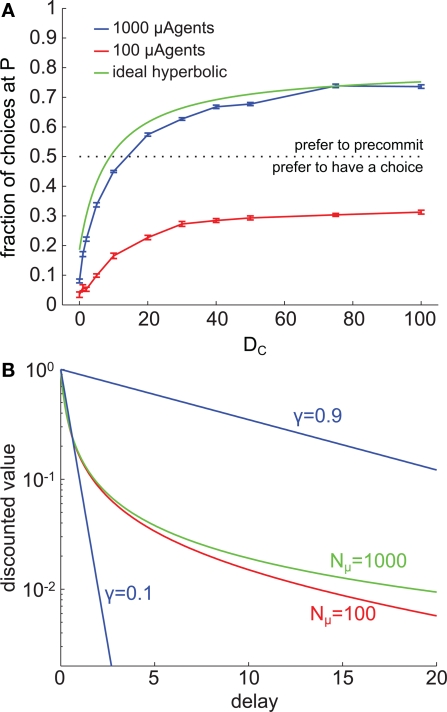
Figure 8.
Precommitment is highly dependent on the shape of the discount curve. (A) These graphs plot the average (across 200 trials) number of times each choice was selected at different values of DC. The blue line shows choices made when Nμ = 1000, and the red line shows choices made when Nμ = 100. (B) The shape of the average discount function depends on the number of μAgents. Red shows the average discounting of 100 μAgents and green shows the average discounting of 1000 μAgents. If a perfect hyperbolic function is plotted on this graph, it overlies the green curve. For reference, exponential discount curves with γ = 0.1 and γ = 0.9 are plotted in blue. The vertical axis is log scale to make visible the separation of the red and green curves. In this figure, k = 5.

