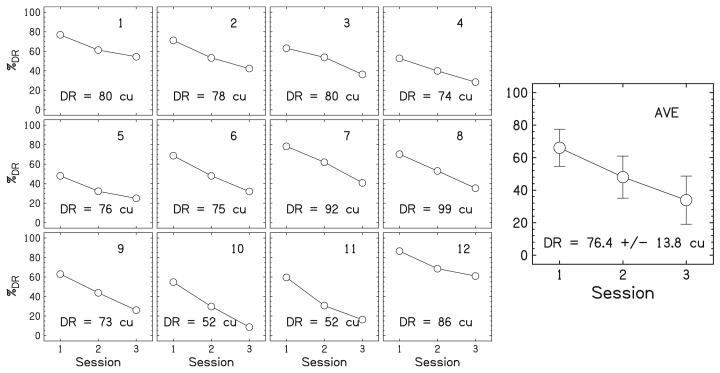
FIG. 2.
The results of the loudness-balancing procedure for a typical listener, CI14. The small panels on the left show the results for individual electrodes. Dynamic ranges (DRs) are reported in cu and correspond to 100%DR. Data points represent levels that are equally loud between electrodes for a given session. Session 3 shows the data for the final current level used for the equal-loudness stimulus in the main experiment. The large panel on the right shows the averaged %DR levels over all 12 electrodes. The error bars show ±1 standard deviation.

