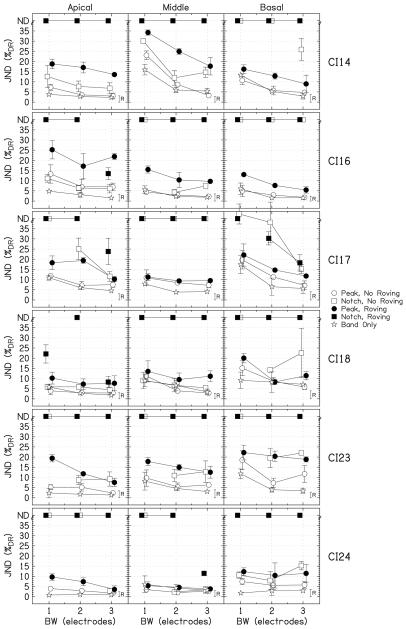
FIG. 3.
The results of experiment 1, which show individual JNDs expressed as %DR for the individual listeners as a function of bandwidth. The circles show the data for the peaks, the squares show the data for the notches, and the stars show the band-only data. The filled symbols indicate the conditions with roving. For notches for which the threshold could not be measured, JNDs are placed at the top of the panels at “ND.” The error bars show ±1 standard deviation. The heights of the roving bars, labeled “R,” on right side of each panel show the level detection limit for BW=3.

