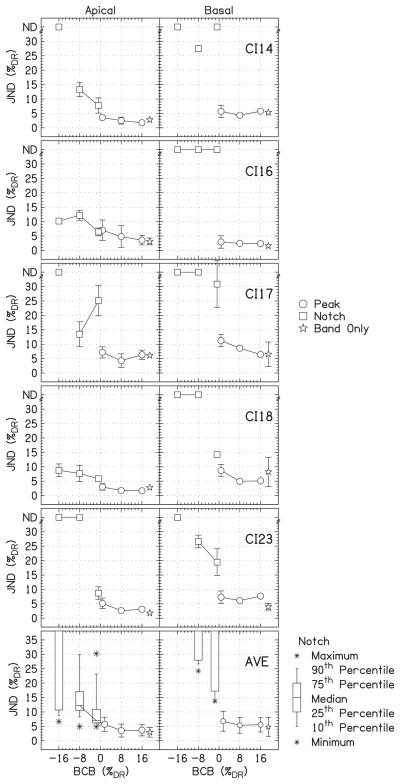
FIG. 5.
Individual and average listener data from the peak height or notch depth discrimination task, experiment 2. The JNDs, expressed as %DR, are plotted for different band currents with respect to the background (BCB). The error bars show ±1 standard deviation. Data for BCB=0%DR and band-only data are replotted from experiment 1. JNDs for notches that were unmeasurable are placed at the top of the panels at “ND.” The notch JNDs are summarized with a box-and-whisker plot.

