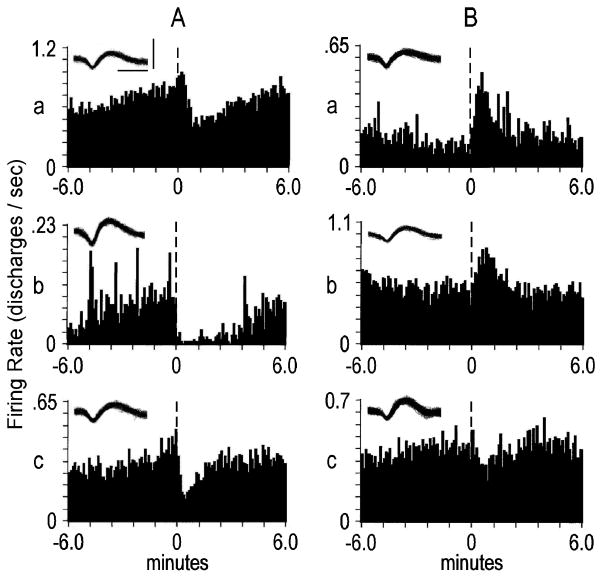
Figure 1.
Examples of slow phasic reversal firing patterns. Each peri-event time histogram (PETH) displays the firing pattern of one neuron during the minutes before and after the lever press. The ordinate of each histogram displays the average firing rate (i.e. average discharges/s calculated as a function of 0.1-min bins). Time 0 (vertical dashed line) on the abscissa marks the occurrence of the cocaine-reinforced lever press. (A) Examples of decrease + progressive reversal firing patterns. (B) Examples of other categories of slow phasic patterns. Top, increase + progressive reversal; middle, increase + early reversal; bottom, decrease + early reversal. For each PETH, the inset depicts the corresponding neural waveform. Calibrations (bars in A, top) of waveforms: 0.25 ms, 0.10 mV (top left waveform); 0.25 ms, 0.20 mV (all other waveforms).

