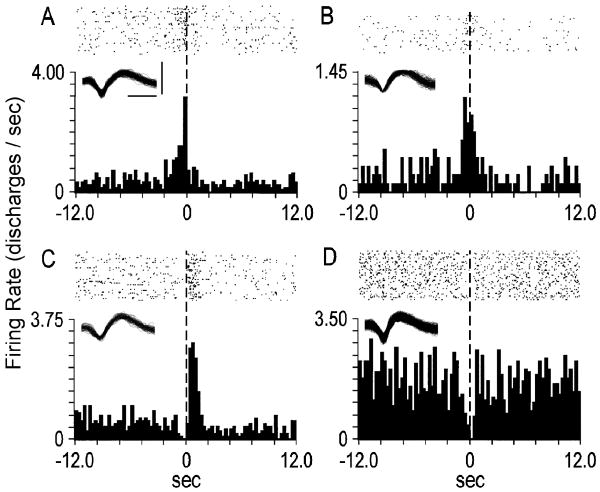
Figure 3.
Examples of rapid phasic firing patterns. Each peri-event time histogram displays the firing pattern of a different neuron during the seconds before and after the lever press. The ordinate of each histogram displays average firing rate (i.e. average discharges/s calculated as a function of 0.2-s bins). Time 0 (vertical dashed line) on the abscissa marks the occurrence of the cocaine-reinforced lever press, and corresponds with the raster display above it. (A) A pre-press firing rate increase. (B) A lever press increase. (C) A post-press increase. (D) A lever press decrease. Insets depict corresponding neural waveforms. Calibrations (bars in A) of waveforms: insets A, B, and C, 0.25 ms, 0.20 mV; inset D, 0.25 ms, 0.15 mV

