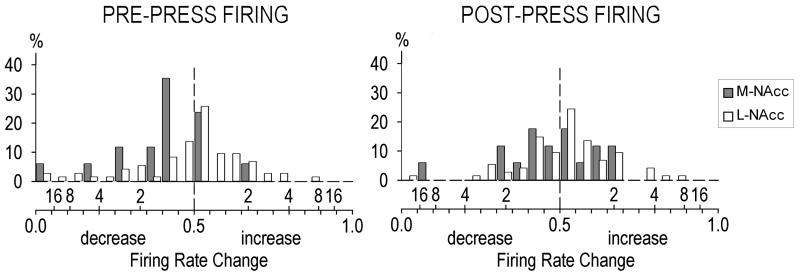
Figure 4.
Frequency distributions of pre-press (left panel) and post-press (right panel) rapid phasic firing rate change magnitudes in the medial nucleus accumbens (M-NAcc) vs. the lateral NAcc (L-NAcc). The magnitude of firing rate change is expressed as B/(A + B) (bottom side of x-axis). Values from 0.49 to 0 and from 0.51 to 1.00 reflect increasingly larger firing rate decreases and increases, respectively. Values of 0.50 reflect no change from baseline firing rate (vertical dashed line). The top side of the x-axis indicates twofold, fourfold, etc. increases above, or decreases below, baseline firing rate values. The ordinate scale indicates percentages of the total neurons in the medial (N = 17) and lateral (N = 74) NAcc. The distribution of pre-press B/A + B increases was greater in lateral NAcc (core/ventrolateral shell) neurons than in medial NAcc (dorsal shell/rostral pole shell) neurons [t26 = 1.71, P = 0.02).

