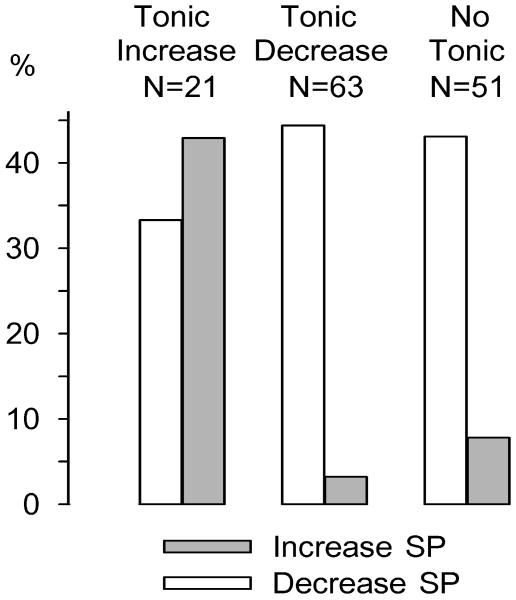
Figure 6.
Percentage of slow phasic (SP) increases and SP decreases among tonic categories. All tonic neurons (n = 135) were evaluated by category (increase, decrease, and non-responsive) for the prevalence of SP increases and decreases within them. SP decreases were observed in 33% of tonic increase neurons, 44% of tonic decrease neurons, and 43% of no tonic change neurons. SP increases were observed in 43% of tonic increase neurons, 2% of tonic decrease neurons, and 8% of no tonic change neurons. A 2 × 3 chi-square test revealed that SP increase and decrease reversal patterns were differentially expressed across tonic categories [χ2(2) = 17.3338, P < 0.001). An odds ratio analysis confirmed a differential prevalence of SP increase and decrease patterns between the tonic increase and decrease categories: odds ratio (95% confidence interval) = 0.0311 (0.0033–0.2892).

