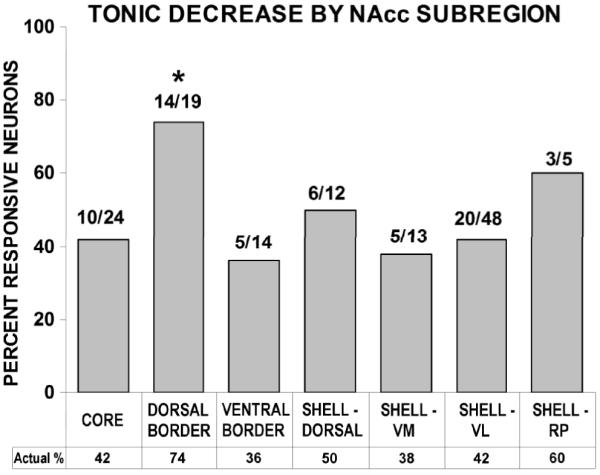
Figure 5.

Tonic firing changes in neurons that exhibit slow phasic firing patterns are differentially expressed among nucleus accumbens (NAcc) subregions. The graph depicts tonic firing data for neurons that exhibited slow phasic firing changes. Symbols indicate subregional placement of histologically confirmed NAcc microwires (see key). B/A + B values from 0.49 to 0 and from 0.51 to 1.00 reflect increasingly larger firing rate decreases and increases, respectively. A rather broad distribution of increases and decreases of slow phasic and tonic firing magnitudes is revealed for lateral NAcc neurons (e.g. core and ventrolateral shell), including opposite signs in firing rate change between time bases (i.e. symbols in upper left and lower right quadrants). For the medial NAcc (i.e. dorsal shell and rostral pole shell) and dorsal border regions, it is notable that slow phasic changes were exclusively decreases in neurons that also exhibited tonic decreases (lower left quadrant). D, dorsal; VL, ventrolateral; RP, rostral pole; V, ventral.
