
Figure 1.
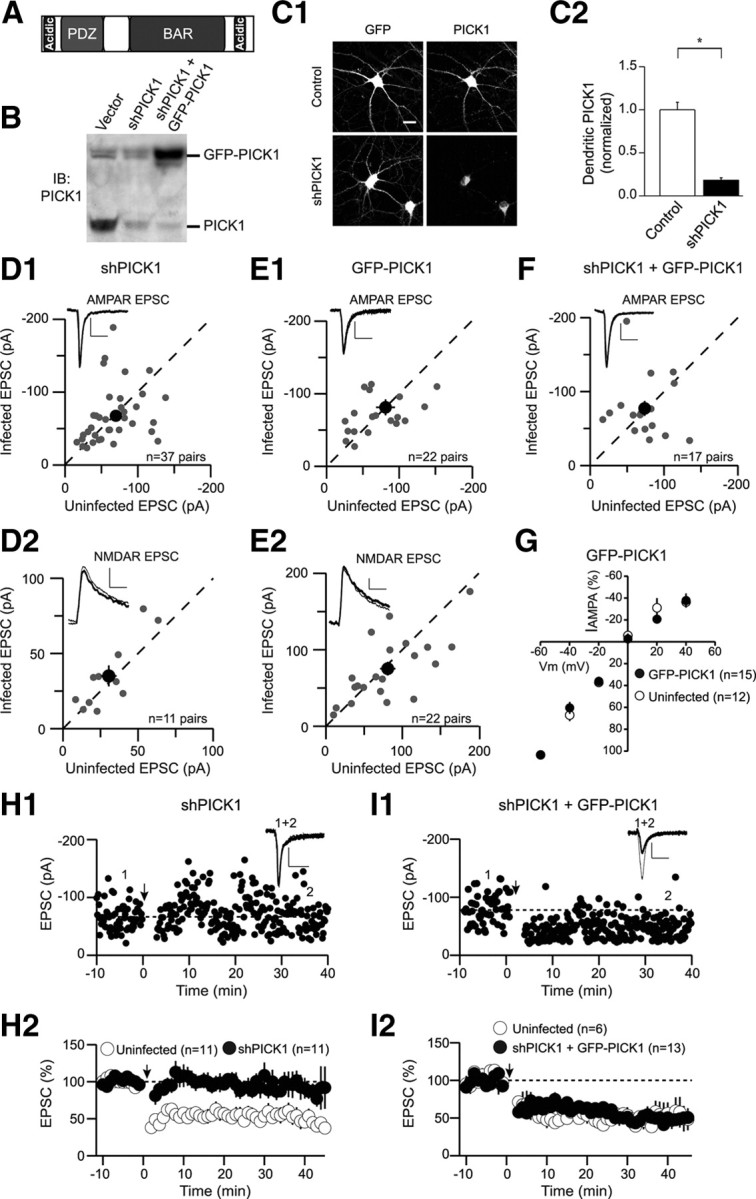
Knockdown of PICK1 does not affect basal synaptic transmission but blocks LTD. A, Schematic depicting the domain structure of PICK1. B, Western blot demonstrating shRNA-mediated knockdown of endogenous PICK1 in dissociated hippocampal cultures. C1, Representative cells showing that endogenous PICK1 staining is reduced by shPICK1 compared with control cells. The cell body staining remaining in the PICK1 knockdown was not abolished by a competitive peptide suggesting it is nonspecific background. Scale bar, 20 μm (for this and all subsequent figures). C2, Quantitation of dendritic PICK1 levels in control and PICK1 knockdown cells (control, 1 ± 0.09, n = 26; shPICK1, 0.18 ± 0.03, n = 29). In this and all subsequent figures, the asterisk (*) indicates p < 0.05, and error bars indicate SEM. D, Amplitude of AMPAR EPSCs (D1, shPICK1, −67.6 ± 6.3 pA; uninfected, −69.7 ± 6.7 pA, n = 37 pairs) and NMDAR EPSCs (D2, shPICK1, 35.1 ± 6.9 pA; uninfected, 30.5 ± 5.2 pA, n = 11 pairs) in neurons expressing shPICK1 are plotted against those of simultaneously recorded uninfected neighboring neurons. In this and subsequent figures, the gray symbols represent single neuron pairs; the black symbol represents mean ± SEM; sample traces appear in the top left corner of each graph. Calibration: 25 pA/50 ms (for this and all subsequent figures). E, Amplitude of AMPAR EPSCs (E1) (GFP-PICK1, −81.3 ± 11 pA; uninfected, −85.5 ± 13 pA, n = 22 pairs) and NMDAR EPSCs (E2) (GFP-PICK1, 75.3 ± 8.9 pA; uninfected, 80.9 ± 10 pA, n = 22 pairs) in neurons expressing GFP-PICK1 are plotted against those of simultaneously recorded uninfected neighboring neurons. F, Amplitude of AMPAR EPSCs in neurons expressing the PICK1 replacement construct (shPICK1 plus GFP-PICK1) are plotted against those of simultaneously recorded uninfected neighboring neurons (shPICK1 plus GFP-PICK1, −77.3 ± 10 pA; uninfected, −73.7 ± 7.6 pA, n = 17 pairs). G, Current–voltage relationship of the pure AMPAR EPSC in control cells (open circles) or cells expressing GFP-PICK1 (closed symbols). H, Knockdown of PICK1 inhibits LTD. H1, Sample experiment demonstrating lack of LTD in a cell expressing shPICK1. Downward arrow in this and all subsequent figures indicates time of LTD induction. In this and all subsequent figures, sample traces correspond to averaged EPSCs recorded at the indicated times (thin traces, averaged EPSCs from baseline; thick traces, averaged EPSCs after LTD induction). H2, Summary graph demonstrating block of LTD in shPICK1 infected neurons compared with interleaved uninfected controls (shPICK1, 87 ± 13%, n = 11; uninfected, 55 ± 10%, n = 11). In this and all subsequent summary graphs, points represent mean ± SEM. I, Replacement of endogenous PICK1 with GFP-PICK1 rescues LTD. I1, Sample experiment demonstrating LTD in a cell expressing shPICK1 plus GFP-PICK1. I2, Summary graph of LTD in shPICK1 plus GFP-PICK1-infected neurons and interleaved controls (shPICK1 plus GFP-PICK1, 50 ± 4% of baseline, n = 13; uninfected, 50 ± 12%, n = 6).