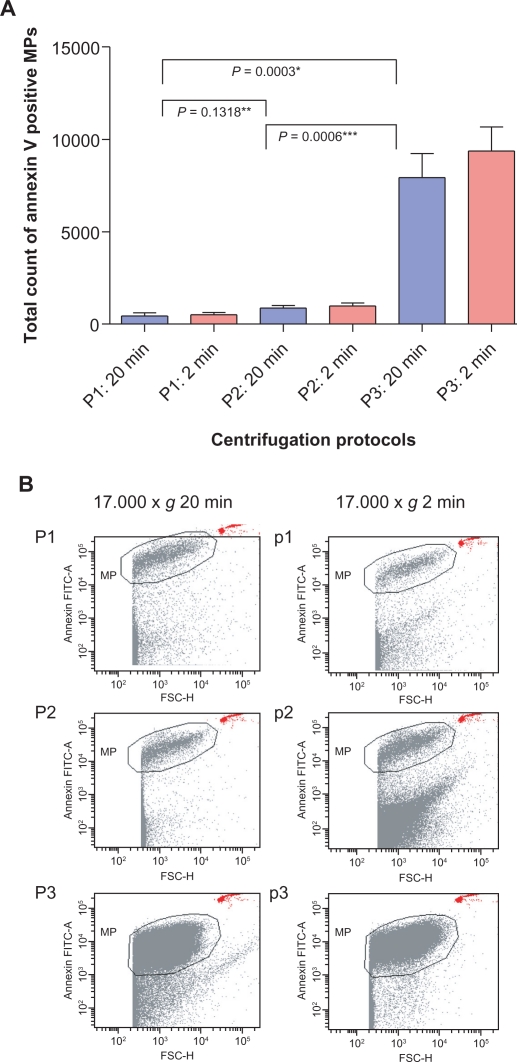
Figure 2.
Flow cytometric analysis of three centrifugation protocols. Each centrifugation protocol consisted of two steps as described in Table 1. A) An initial centrifugation step at 1500 × g (P3) showed significantly higher microparticle numbers than P1 and P2 at 5000 × g. No significant difference was detected between P1 and P2. There was no significant difference regarding the duration of the second centrifugation step at 17,000 × g (two or 20 minutes, P > 0.05). B) Dot plots, showing that clear separation between debris and Annexin V-positive microparticles was only achieved with P1 and P2, whereas P3 led to an indistinct cutoff (*P < 0.005 comparing protocol P3 with P1 and P2).

