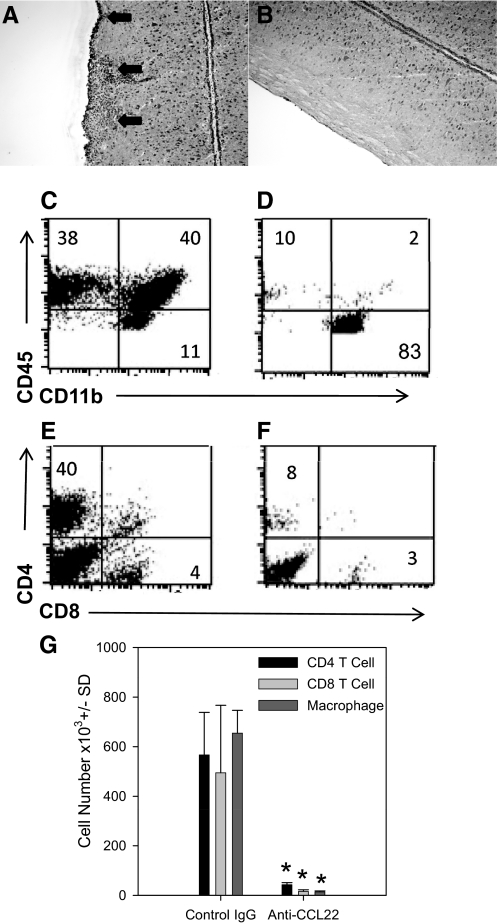
Figure 3. Anti-CCL22 treatment inhibited CNS inflammation.
(A) Representative photomicrograph (original magnification, 100×) of the H&E-stained lumbar spinal cord section from a control Ig-treated mouse. The data indicate extensive mononuclear cell infiltration (arrows). (B) Representative photomicrograph (original magnification, 100×) of a H&E-stained lumbar spinal cord section from an anti-CCL22-treated mouse. The data indicate a lack of mononuclear cell infiltration. (C) Representative flow cytometric analysis of CNS-infiltrating mononuclear cells from a control Ig-treated mouse. The dot plots are derived from a combined forward- and side-scatter and CD45+ gate. The percentages of cells in each quadrant are indicated: 38% lymphocytes, 40% macrophages/DCs, and 11% microglia. (D) Representative flow cytometric analysis of CNS-infiltrating mononuclear cells from an anti-CCL22-treated mouse. The dot plots are derived from a combined forward- and side-scatter and CD45+ gate. The percentages of cells in each quadrant are indicated: 10% lymphocytes, 2% macrophages/DCs, and 83% microglia. (E) Representative flow cytometric analysis of CNS-infiltrating CD4 and CD8 T cells from a control Ig-treated mouse. The dot plots are derived from a combined forward- and side-scatter and CD45+ gate. The percentages of cells in each quadrant are indicated: 40% CD4 T cells and 4% CD8 T cells. (F) Representative flow cytometric analysis of CNS-infiltrating CD4 and CD8 T cells from an anti-CCL22-treated mouse. The dot plots are derived from a combined forward- and side-scatter and CD45+ gate. The percentages of cells in each quadrant are indicated: 8% CD4 T cells and 3% CD8 T cells. (G) Quantification of the total number of CNS-infiltrating CD4 and CD8 T cells and macrophages. Individual mice (n=5) in control- and anti-CCL22-treated groups were assessed for the presence of mononuclear cells in the spinal cord at the time of peak clinical disease in the control-treated group by flow cytometry. The data are expressed as the mean cell number (±sd) and demonstrate significantly (*P<0.05) fewer CD4 and CD8 T cells and macrophages in the anti-CCL22-treated mice. The results are representative of three independent histologic experiments and two independent flow cytometric analyses.

