Figure 1.
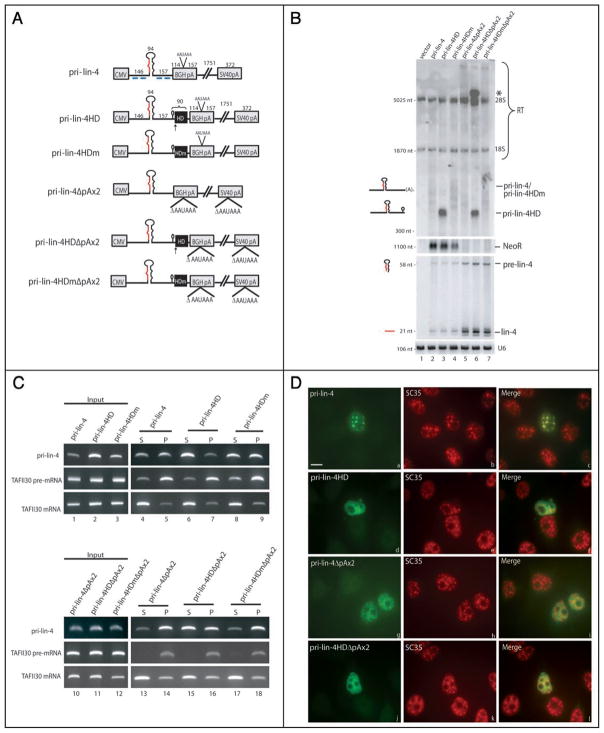
Pri-miRNAs with ribozyme-generated 3′ ends are not processed efficiently and do not localize to SC35-containing nuclear foci. (A) Schematic of pri-miRNA constructs. CMV (cytomegalovirus), BGH (bovine growth hormone), and SV40 (simian virus 40) denote the vector-derived CMV promoter and the BGH or SV40 cleavage and polyadenylation signal. The pri-miRNA insert is shown in black, with the pre-miRNA represented as a large hairpin and the mature miRNA sequence indicated in red. Black boxes show the location of either the wild type (HD) or the mutant (HDm) ribozyme. Arrows indicate the site of ribozyme cleavage, with the small histone mRNA 3′ hairpin immediately upstream. The lengths in nts of the pri-miRNA insert and surrounding sequences are indicated above the pri-miRNAs. (B) Northern blot analysis of pri-miRNA processing. Constructs diagramed in A were transfected into HeLa cells, and total RNA was analyzed by Northern blotting using either a denaturing formaldehyde/agarose gel to detect pri-miRNAs (top) or a 15% denaturing urea/polyacrylamide gel to visualize the precursor and mature miRNAs (bottom). 28S and 18S rRNA are indicated and serve as loading controls. The neomycin resistance gene (NeoR) was probed as a transfection efficiency control (note that pri-lin-4ΔpAx2 constructs do not produce a NeoR transcript because the downstream SV40 CPA signal is deleted). Mature miRNA Northern blots were probed for the U6 small nuclear RNA as a loading control. RT indicates readthrough transcripts. The asterisk denotes the pri-lin-4HDΔpAx2 transcript that has transcribed around the plasmid and undergone ribozyme cleavage after the second encounter. (C) Nuclear fractionation of pri-miRNAs. Cells transfected as in (B) were fractionated into released, nucleoplasmic RNAs (supernatant [S]) and chromatin-associated RNAs (pellet [P]). Fractionated RNA was reverse transcribed and amplified by PCR. TAFII30 pre-mRNA and fully spliced mRNA were amplified as controls for loading and fractionation efficiency. (D) ISH to pri-lin-4 transcripts, followed by IF to SC35 on cells transfected as in (B), using DIG-labeled probes complementary to regions diagramed in (A) (blue lines). Scale bar, 10 μm.

