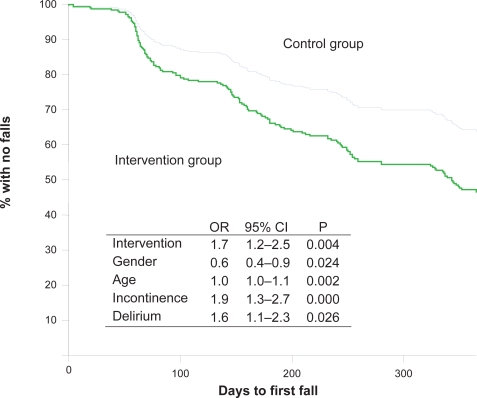
Figure 2.
Kaplan–Meier curves presenting time to first fall for the intervention group (n = 200 participants) versus the control group (n = 131 participants) controlled for by age, gender, delirium, and urine incontinence.
Abbreviations: OR, odds ratio; 95% CI, 95% confidence interval for OR; P, P value.

