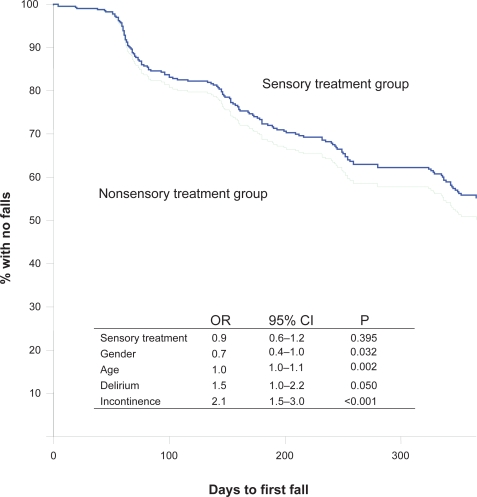
Figure 3.
Kaplan–Meier curves presenting time to first fall of persons who received sensory treatment versus persons who did not, controlled for by age, gender, delirium, and urine incontinence. Sensory treatment group, n = 117; nonsensory treatment group, n = 214.
Abbreviations: OR, odds ratio; 95% CI, 95% confidence interval for OR; P, P value.

