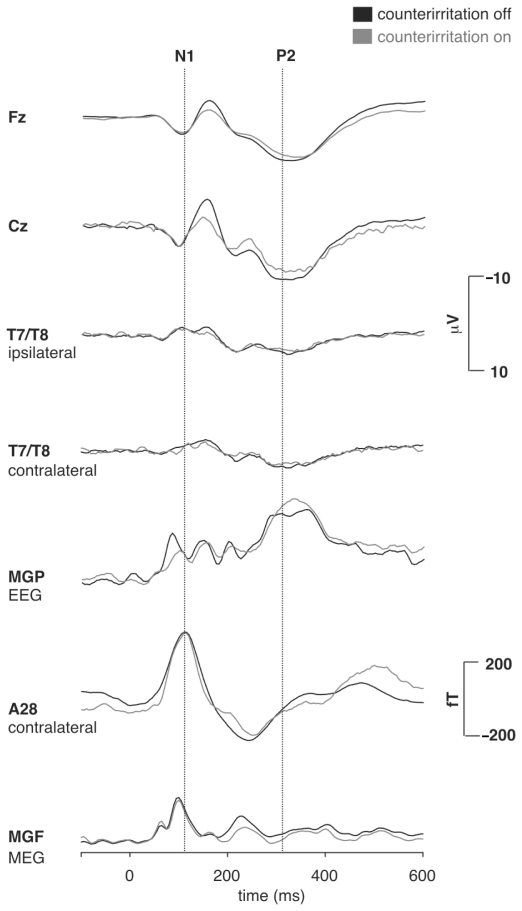
Figure 2.
Grand mean average waveforms for the EEG channels (upper 5 traces: Fz, Cz, T7, T8, and MGP; = mean global potential curve) and MEG (lower 2 traces: SQUID sensor A28 and MGF; = mean global field curve). Patients showed a decrease of the EEG N2/P2-component during counterirritation, whereas no change occurred in the EEG N1 and the MEG M1 during counterirritation.

