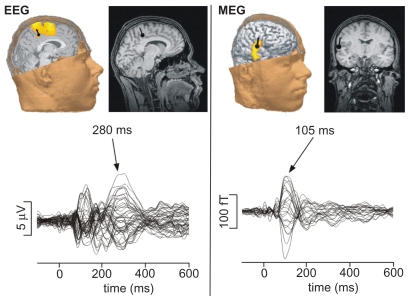
Figure 3.
Dipole reconstruction with current density of a single patient (EM) with the corresponding butterfly plots of all channels after painful electrical finger stimulation (60 stimuli) without counterirritation. Maximal EEG activity (P2; 280 ms) could be explained with a GOF > 95% by a single fixed dipole localized in the mid cingulate gyrus with the coordinates x = 2.5; y = −12.9; z = 40.5. MEG activity (N1-correlate) after 105 ms yielded in a single dipole in the contralateral SII-cortex (GOF > 95%) with the coordinates x = 59.7; y = −30.1; z = 15.6.

