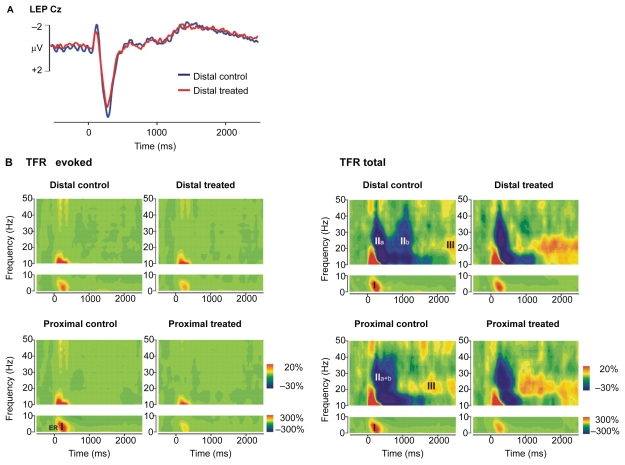
Figure 3.
Evoked and total TFR plots illustrating the effects of topical capsaicin treatment at distal and proximal stimulus sites. For comparison, the LEP at central electrode Cz obtained from stimulation at distal treated and control sites is also shown top left. Time frequency data represent responses from central ROIs averaged across all subjects (N = 16). They are plotted as percentage change of signal amplitude relative to pre-stimulus baseline (−1000 to −200 ms). A) Phase-locked evoked response increase (ER I: 3–7 Hz, 0–500 ms) is diminished by skin sensitization as is the N2–P2 component of the LEP. B) Total TFR also reveals a stimulus-induced increase from 3 to 7 Hz (TR I), which was followed by an alpha-to-gamma decrease (TR II) around 1000 ms (distal). This decrease has two minima (TR IIa, TR IIb), the latter delayed as predicted by C-fiber conduction velocity between proximal and distal stimulus sites and suppressed by topical capsaicin treatment. A later upper beta increase (TR III: 15–30 Hz, 1400–2100 ms, distal) also shows a shift in latency between proximal and distal stimulation that is compatible with C-fiber conduction velocity. It exhibits an enhancement following capsaicin treatment.
Abbreviations: LEP, laser-evoked potentials; ROI, region of interest; TFR, time frequency representation.

