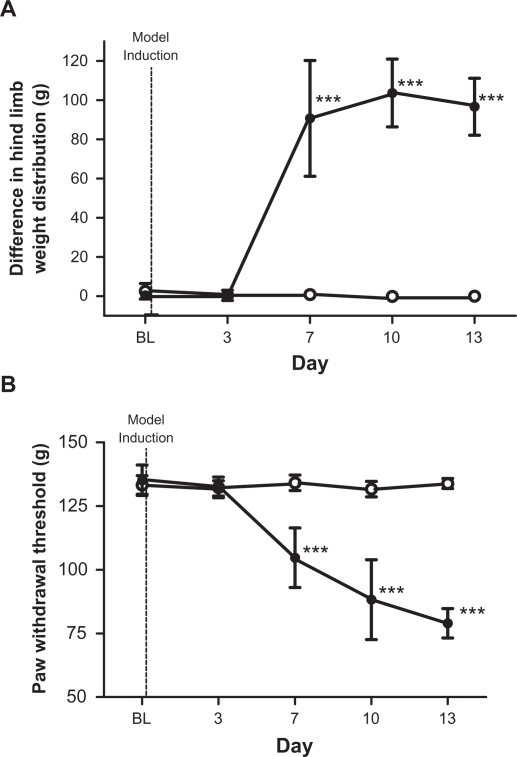
Figure 5.
(A) Incapacitance test results. Figure displays the differential hind leg weight distribution in vehicle (n = 8, ○) and MLL (n = 10, •) cell injected rats. Hind limb weight difference was measured in grams (g). Data are displayed as mean ± SD. At BL, both groups displayed no significant difference in weight distribution between both hind legs. Dotted line indicates point of model induction. ***P < 0.001. (B) Randall–Selitto test results. Figure displays the paw withdrawal threshold in vehicle (n = 8, ○) and MLL (n = 10, •) cell-injected rats. Paw withdrawal threshold was measured in grams (g) of force. Data are displayed as mean ± SD. Dotted line indicates point of model induction. ***P < 0.001.
Abbreviations: BL, baseline from reading from each group; MLL, MATLyLu; SD, standard deviation.

