Figure 1.
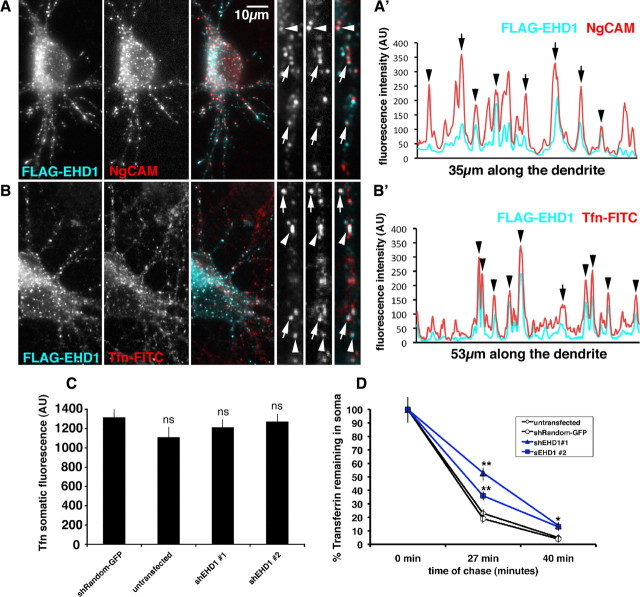
EHD1 colocalizes with endocytosed NgCAM and transferrin and is important for transferrin recycling. A, Neurons coexpressing FLAG–EHD1 (cyan) and NgCAM (red) were allowed to endocytose anti-NgCAM antibodies for 20 min before fixation. Endocytosed NgCAM was detected with a secondary antibody, whereas FLAG–EHD1 was detected with anti-FLAG rabbit antibody. Single channels as well as overlaid channels (colocalization appears white) are shown for the soma region and part of a dendrite. Scale bar, 10 μm. A′, Representative intensity line scan of FLAG–EHD1 (cyan) and NgCAM (red) along a dendrite is shown. Endosomes correspond to the peaks on the trace. Overlapping peaks for FLAG–EHD1 and NgCAM indicate colocalization of both markers. B, Neurons expressing FLAG–EHD1 (cyan) were allowed to endocytose FITC rat transferrin (red) for 1 h before fixation. FLAG–EHD1 was detected with anti-FLAG rabbit antibody. B′, Representative intensity line scan of FLAG–EHD1 (cyan) and transferrin (red) along the dendrite is shown. Precisely coaligned peaks are marked with arrowheads. Peaks with lateral offset are marked with arrows. C, Untransfected neurons or neurons transfected with either shEHD1 #1–GFP or shEHD1 #2–GFP or shRandom–GFP were allowed to uptake cyanine 3 rat transferrin for 1 h. D, Untransfected neurons (clear rhombus) or neurons transfected with either shEHD1 #1 (blue triangle) or shEHD1 #2 (blue square) or shRandom (clear circle) were allowed to uptake cyanine 3 rat transferrin for 1 h, then unbound transferrin was washed out, and bound transferrin was chased for 0, 27, and 40 min. Percentage of transferrin retained in soma was measured and normalized to t (0). Statistics were performed using Student's t test. *p < 0.01, **p < 0.0001. Error bars indicate SEM. AU, Arbitrary units.

