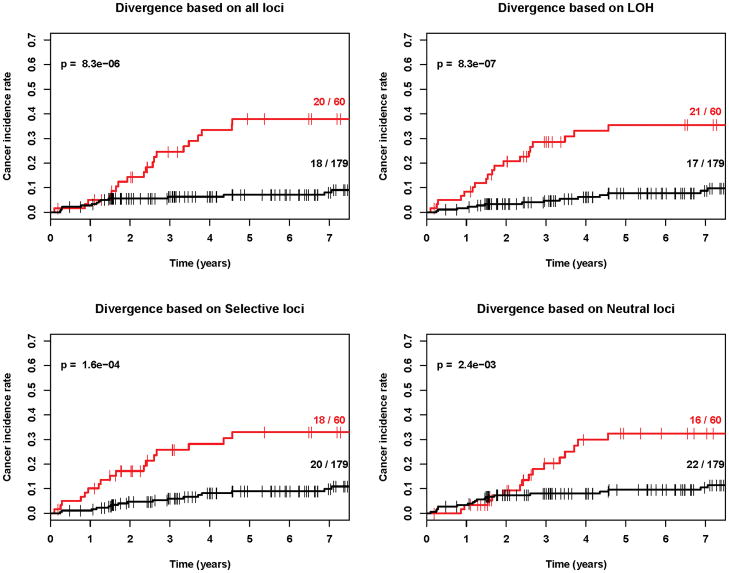
Figure 3.
Kaplan-Meier cancer incidence curves for mean pairwise genetic divergence based on four different definitions of clones (p<0.001 in all cases). Red=upper quartile, Black=bottom three quartiles. The (number of cancers/total number of participants) in the upper and lower 3 quartiles are given as numbers to right of the curves.

