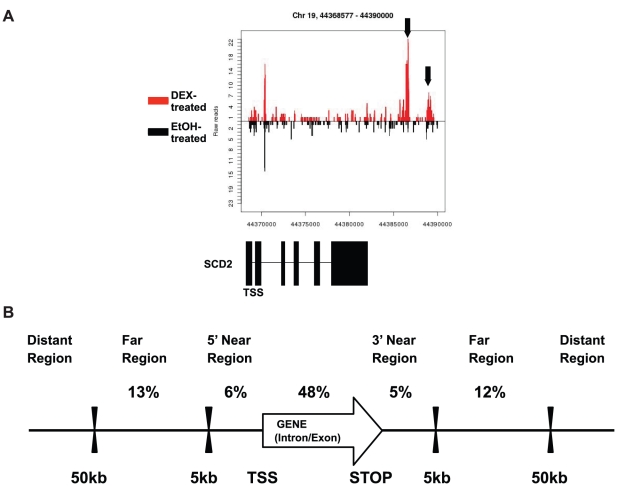
Figure 1. Genomic distribution of glucocorticoid receptor binding sites binding sites and response elements.
A) An example of ChIPseq data showing the number of ChIPseq sequencing tag in Scd-2 gene. ChIP-seq data are plotted as the density of 36-bp tags mapping to the region. The density is separated to show the reads (Y-axis) mapping to the reference genome (X-axis) in DEX (red) or ethanol (black) treated samples. B) Enrichment of GBRs in genomic features. The percentage of all identified GBRs in each type of region was shown.

