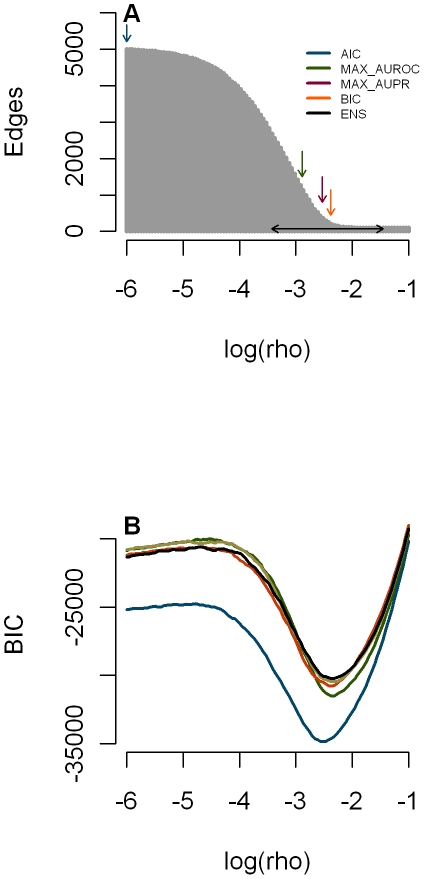
Figure 2. Influence of the graphical Lasso penalty on network complexity and Bayesian Information.
A: Number of edges versus penalty for data set 3 in the multifactorial challenge with down arrows indicating the chosen  associated with (from left to right) AIC, MAX_AUROC, MAX_AUPR and BIC. The horizontal line connects
  and
and  of the 50 best BIC networks chosen in the ensemble network. B: BIC versus penalty for the five data sets.

