Figure 1.

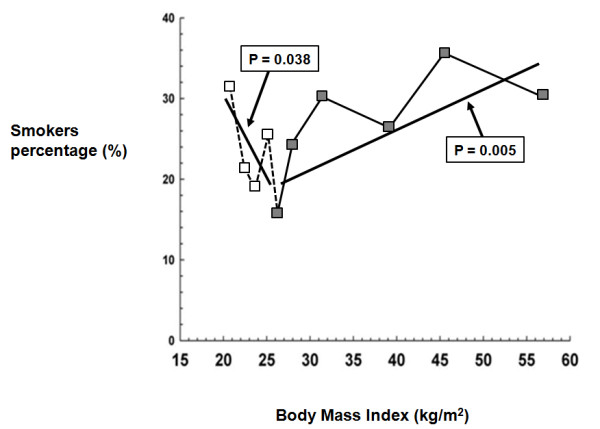
Line graph representing the relationship between body mass index and percentage of smokers. Normal weight: dotted lines; overweight, obese and morbidly obese: continuous line

Line graph representing the relationship between body mass index and percentage of smokers. Normal weight: dotted lines; overweight, obese and morbidly obese: continuous line