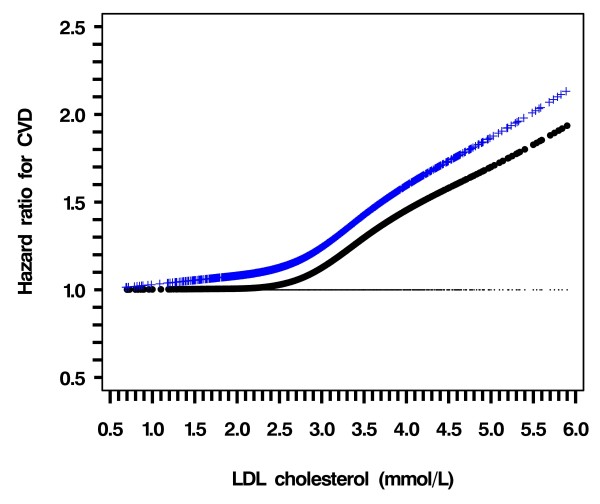
Figure 1.
Hazard ratio of LDL-C for risk of CVD using restricted cubic spline Cox model analysis. Dotted curve (black), not adjusted for other covariates except for HDL-C and triglyceride; Crossed curve (Blue), Adjusted for age, smoking status, duration of diabetes, HbA1c, Ln (ACR + 1), gliclazide and rosiglitazone during follow up, years of enrolment (selected by the stepwise algorithm with P = .10 for inclusion and removal)

