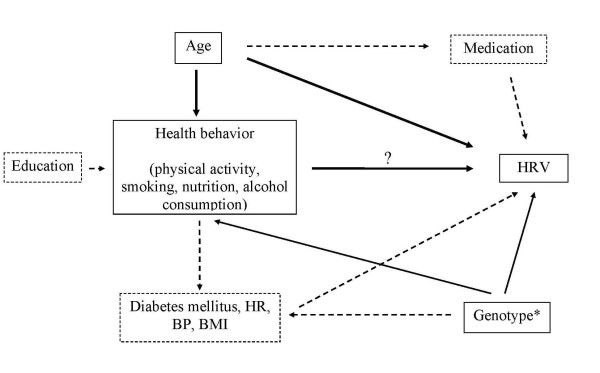
Figure 1.
Directed acyclic graph (DAG) as the general basis of the confounder selection for the statistical analysis. This DAG resulted in simple age-adjusted models in the analysis of the association of healthbehaviour with HRV. BP = Blood Pressure; BMI = Body Mass Index; CVD = Cardiovascular Diseases; HR = Heart Rate; *unmeasured; solid lines: potential confounder according to DAG; dotted lines: there is no confounding according to DAG.

