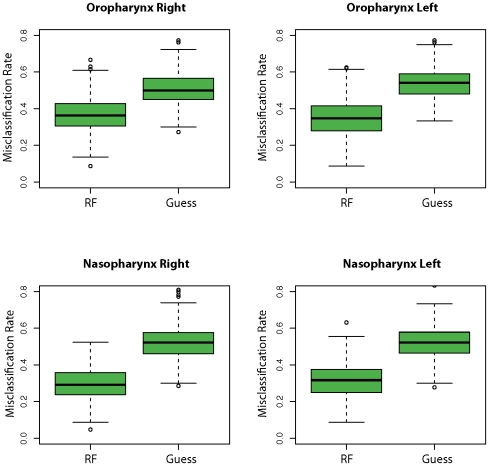
Figure 3. Partitioning airway microbial communities by smoking status using Random Forrest.
Bacterial communities from each airway site were sorted by smoking status using the Random Forests trained algorithm and compared to guessing. Misclassification frequencies are plotted by airway site and side of body. RF = Random Forrest machine. Guess = guessing alone. The lower- and upper-most bars designate the lowest and highest value excluding outliers (defined as >1.5*IQR). The bottom and top of the green boxes denote the lower and upper hinge (close to 25% and 75% quantiles). The heavy black line designates the median misclassification frequency. The distribution of misclassification errors is significantly different between the two algorithms (P – value<2.2E-16 for all airway sites, Friedman Rank Sum test) and in all airway sites, Random Forests performs better than guessing (95% Confidence Interval: oropharynx right (−0.15–−0.13), oropharynx left (−0.20–−0.18); nasopharynx right (−0.23–−0.22), nasopharynx left (−0.22–−0.20).

