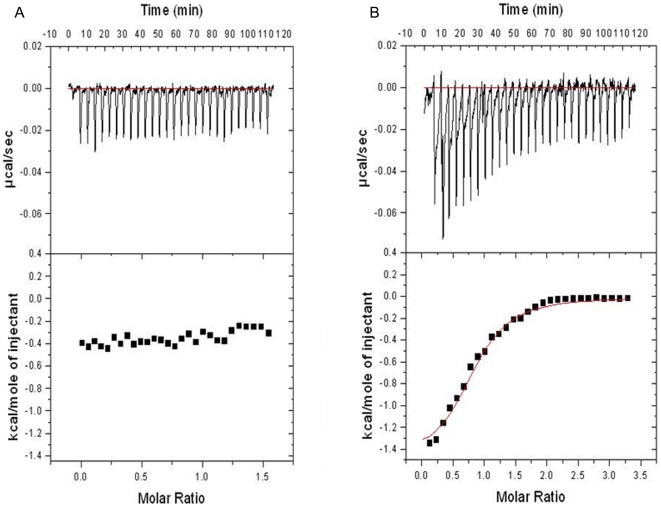
Figure 7. Isothermal Titration Calorimetry analysis.
(A) Human α- thrombin- wild type CrSPI-1-D1 titration. (B) Human α- thrombin - T4A, Y5K, K6H, P7R CrSPI-1-D1 titration. The upper panels show the injection profile after baseline correction and the bottom panel shows the integration (heat release) for each injection.

