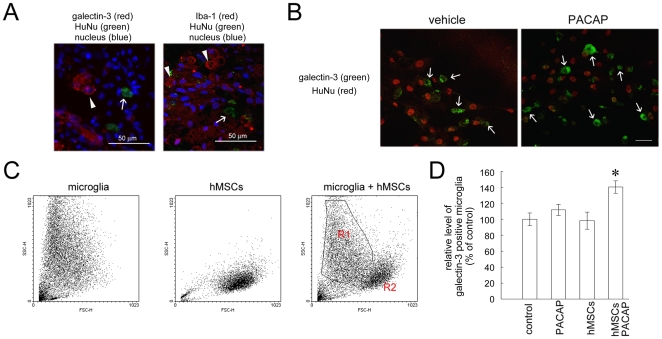
Figure 6. Galectin-3 positive microglia increased by combinatorial treatment with PACAP and hMSCs.
(A). The injured spinal cord was collected at day 14 post SCI, which was sectioned and subjected to immunofluorescence staining for galectin-3 (red, arrowhead)/HuNu(green, arrow) and Iba-1 (red, arrowhead)/HuNu (green, arrow). The tissue sections were then incubated with DAPI for nuclear counterstain. (B). Microglia-hMSC co-cultures were treated with PACAP (100 nM) for 24 hours, and then subjected to immunofluorescence staining for galectin-3 (green) and HuNu (red). (C). A representative cytogram of microglia and hMSCs was shown in the left and middle panel, respectively. Accordingly, the cytogram of microglia-hMSC co-culture indicates two cell populations (right panel): microglia scattering in R1, and hMSCs appearing in R2. (D) Microglia were treated with PACAP (100 nM), or co-cultured with hMSCs in the absence or presence of PACAP (100 nM). 24 hours later, the relative levels of galectin-3 positive microglia were determined by FACS. The data represent as the relative level of galectin-3 positive microglia by determining the ratio of galectin-3 positive microglia being analyzed in the region of R1 (C) in comparison with that detected in the control culture. The images shown in B and C were taken from confocal microscopy. Data consist of means ± SEM of three independent experiments. Scale bar in A, 50 µm; in B, 40 µm. *p<0.05 versus control.

