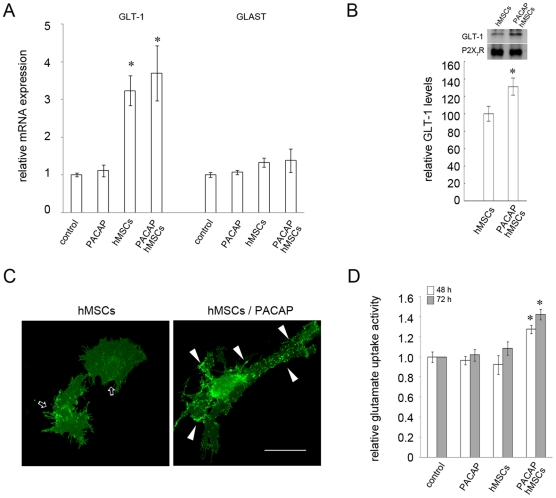
Figure 7. GLT-1 production and glutamate uptake ability of astrocytes promoted by combinatorial treatment with PACAP and hMSCs.
(A). Astrocytes were treated with PACAP (20 ng/ml), or indirectly co-cultured with hMSCs in the absence and presence of PACAP (20 ng/ml) for 48 hours. The cultures were subjected to Q-PCR for measurement of the mRNA levels of GLT-1 and GLAST. Data are presented as mean ± SEM and expressed as the ratio of GLT-1 (GLAST) mRNA levels compared to control. *p<0.05 versus control. (B). Astrocytes were indirectly co-cultured with hMSCs in the absence or presence of PACAP for 48 hours. Membrane proteins were then extracted for western blotting using anti-GLT-1 antibody. The same blot was reprobed with anti-P2X7R antibody. P2X7R levels are presented as a loading control. Relative intensity of GLT-1 levels normalized to P2X7R was measured. Data are presented as mean ± SEM and expressed as a percentage of GLT-1 levels in the group with combinatorial treatment compared to that detected in the group co-cultured only with hMSCs. *p<0.05 versus the group only co-cultured with hMSCs. (C). Astrocytes were infected by lentivirus carrying lenti-GLT-1-GFP, and then co-cultured with hMSCs in the absence or presence of PACAP. Strong punctate fluorescence spots (arrowheads) were observed in the processes of astrocytes co-cultured with hMSCs in the presence of PACAP, when compared to that seen in astrocytes co-cultured only with hMSCs (arrows). Scale bar, 50 µm. (D). Astrocytes were treated with PACAP, or co-cultured with hMSCs in the absence or presence of PACAP. After 48 or 72 hours, the cultures were subjected to [3H]-L-glutamate uptake analysis as described in Materials and Methods. Data are presented as mean ± SEM and expressed as a ratio of the glutamate uptake in each treated group compared to that detected in the control group. *p<0.05 versus control.

