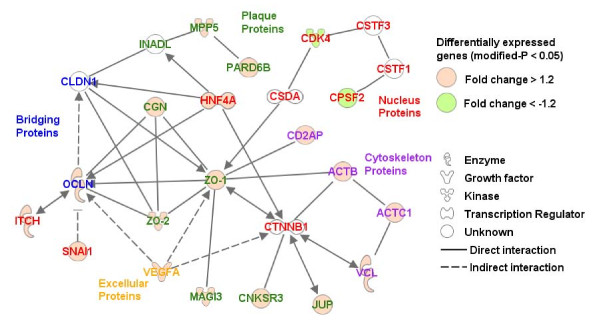
Figure 3.
Network of genes involved in tight junction formation that were differentially expressed by Caco-2 cells after being co-cultured with L. plantarum MB452 (OD600 nm 0.9) for 10 hours. Genes are represented as nodes and the biological relationship between two nodes is represented as an edge. All edges are supported by at least one reference from the literature. Red and green colored nodes indicate genes that have increased or decreased expression, respectively, in response to L. plantarum MB452. The colors of the gene names indicate the role the encoded proteins in relation to tight junctions.

