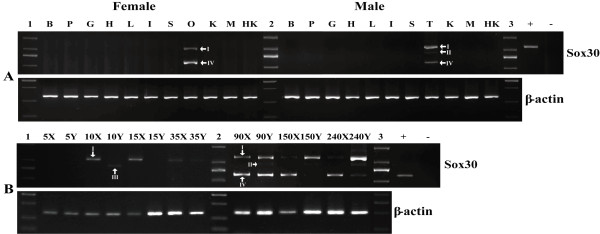
Figure 5.
Expression patterns of Sox30 in the Nile tilapia. (A) RT-PCR analysis of Sox30 from various tissues of adult fish. B, brain; P, pituitary; G, gill; H, heart; L, liver; I, intestine; S, spleen; O, ovary; K, kidney; M, muscle; HK, Head kidney; T, testis; 1, 2, and 3, marker; +, positive control; -, negative control; β-actin was used as the internal control; (B) Ontogeny (5-240 dah) of Sox30 expression in tilapia gonads by RT-PCR. 1, 2, marker; X, female; and Y, male; +, positive control; -, negative control; I, II, III, IV indicate isoform-I, -II, -III and -IV, respectively.

