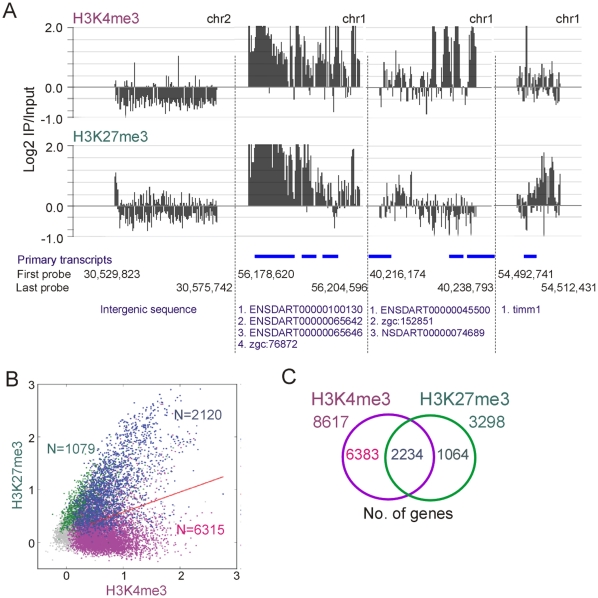
Figure 4. H3K4me3 and H3K27me3 enrichment profiles in ZF4 cells.
(A) Distinct H3K4me3 and H3K27me3 enrichment profiles on indicated genomic regions. Genomic positioning is indicated by nucleotide number of the first (5′) and last (3′) probe in the tiled region. Gene names or accession numbers as well as their genomic position are shown in blue. (B) 2-D scatter plot of averaged MaxSixty values for H3K4me3 vs. H3K27me3 log2 signal intensities. Data points (all points being shown in gray) were colored to visualize classification according to peak calling highlighting H3K4me3-enriched promoters (purple; N = 6315), H3K27me3-enriched promoters (green; N = 1079) and H3K4me3/K27me3-co-enriched promoters (blue; N = 2120). Red line is the regression line through all data points. (C) Venn diagram analysis of H3K4me3 and H3K27me3 genes.

