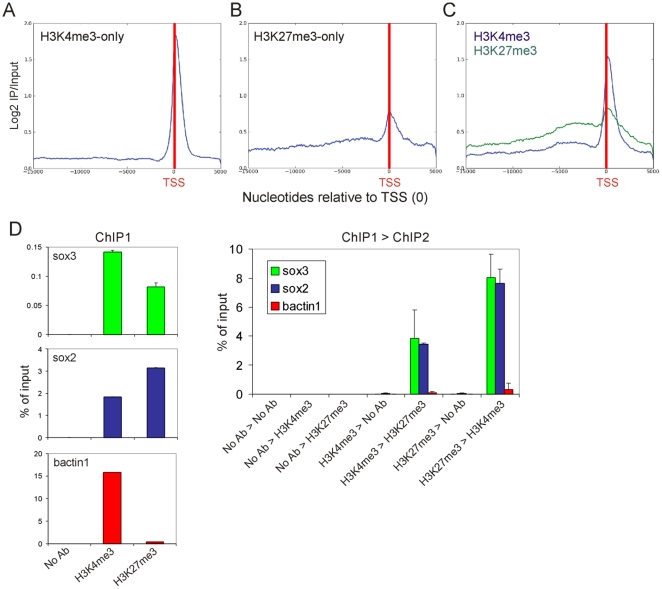
Figure 5. Distribution of H3K4me3 and H3K27me3 on promoters.
Metagene analysis of the distribution of H3K4me3 and H3K27me3 occupancy on (A) H3K4me3-only, (B) H3K27me3-only and (C) H3K4me3/K27me3 tiled regions, relative to the TSS (red vertical bar). (D) Sequential ChIP analysis of H3K4me3 and H3K27me3 co-enrichment on the sox3, sox2 promoters and on bactin1, downstream of the coding region. Panels on the left show results from the first ChIP using antibodies indicated on the x-axis. The graph on the right shows results of the re-ChIP experiment as indicated on the x-axis.

