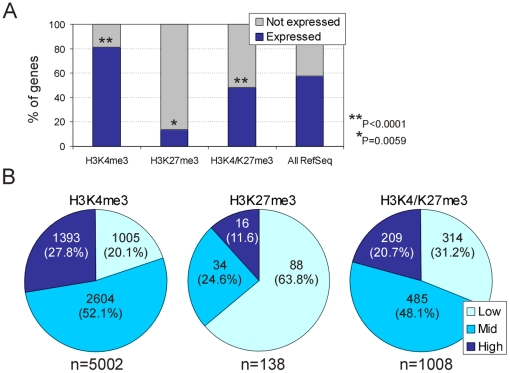
Figure 7. Gene expression status in relation to histone modification enrichment.
(A) Percentage of expressed and non-expressed genes marked by indicated histone modifications, and among all RefSeq genes co-represented on both the Agilent and Nimblegen arrays (n = 11,971). (B) Percentile analysis of expression levels of genes marked by indicated modifications. Low, 25th percentile; Mid, 25th<x<75th percentile; High, >75th percentile. Only expressed genes (blue bars in A) are taken into the analysis. Numbers within the pie charts indicate the number of genes in each category; numbers are the bottom indicate the number of expressed genes (Present call) marked by either or both histone modifications.

